Here are 26 questions on SJF(SHORTEST JOB FIRST) process scheduling algorithms (premptive AND non-premptive). Each question is presented in a table format, followed by the solution with Gantt charts, average turnaround time (TAT), and average waiting time (WT).
Shortest Job First (SJF) is a process scheduling algorithm in which the process with the shortest execution time is selected for execution next. This scheduling technique is also known as Shortest Job Next (SJN) and can be either preemptive or non-preemptive.
- Step 1: Identify all processes in the queue along with their burst times.
- Step 2: Sort the processes based on their burst times (shortest to longest).
- Step 3: Select the process with the shortest burst time and execute it.
- Step 4: Once completed, remove it from the queue and update the waiting and turnaround times for all processes.
- Step 5: Repeat steps 2 to 4 until all processes are executed.
| Advantages | Disadvantages |
|---|---|
| Minimizes average waiting time. | Not practical for real-time scheduling as burst times are often unknown. |
| Simple and easy to understand. | Can cause starvation for longer processes. |
| Effective in a batch processing environment. | Requires knowledge of all process burst times. |
| Optimal in terms of reducing average waiting time. | Challenging to implement in interactive systems. |
| Works well with a small number of processes. | Not suitable for time-sharing environments. |
| Lower CPU idle time for batch jobs. | High overhead if Burst Times vary widely. |
SJF is more efficient in reducing the average waiting time compared to other scheduling algorithms, especially when burst times are predictable. It prioritizes shorter tasks, which helps optimize the utilization of CPU resources. However, it is only optimal when burst times can be determined in advance, which is often possible in batch processing systems but not in real-time or interactive environments.
Question 1:Given the Arrival Time and Burst Time of processes, use the Non-Preemptive Shortest Job First (SJF) scheduling algorithm to create the Gantt chart and compute the average Turnaround Time, Completion Time, and Waiting Time.
| Process | Arrival Time | Burst Time |
|---|---|---|
| P1 | 0 | 6 |
| P2 | 2 | 4 |
| P3 | 4 | 3 |
| P4 | 6 | 5 |
| P5 | 8 | 2 |
Solution :
Formulas:
- Turn Around Time (TAT) = Completion Time (CT) - Arrival Time (AT)
- Waiting Time (WT) = Turn Around Time (TAT) - Burst Time (BT)
Gantt Chart

| Process | Completion Time | Turn Around Time (TAT) | Waiting Time (WT) |
|---|---|---|---|
| P1 | 6 | 6 | 0 |
| P2 | 15 | 13 | 9 |
| P3 | 9 | 5 | 2 |
| P4 | 20 | 14 | 9 |
| P5 | 11 | 3 | 1 |
Formula for average TAT and WT:
- Average Turn Around Time (Average TAT) = Σ(TAT) / Number of Processes
- Average Waiting Time (Average WT) = Σ(WT) / Number of Processes
Average Turn Around Time (TAT) = (6+13+5+14+3)/5 = 8.2 units
Average Waiting Time (WT) = (0+9+2+9+1)/5 = 4.2 units
Question 2: Apply the Non-Preemptive SJF scheduling method to the processes listed with their Arrival and Burst Times. Draw the Gantt chart and calculate average Waiting Time, Turnaround Time, and Completion Time.
| Process | Arrival Time | Burst Time |
|---|---|---|
| P1 | 0 | 8 |
| P2 | 1 | 4 |
| P3 | 2 | 9 |
| P4 | 3 | 5 |
| P5 | 4 | 3 |
Solution :
Formulas:
- Turn Around Time (TAT) = Completion Time (CT) - Arrival Time (AT)
- Waiting Time (WT) = Turn Around Time (TAT) - Burst Time (BT)
Gantt Chart
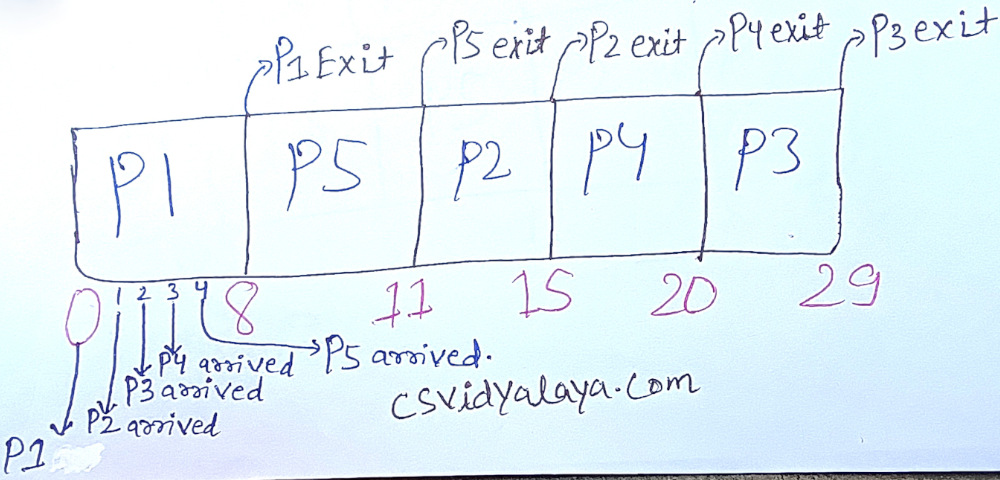
| Process | Completion Time | Turn Around Time (TAT) | Waiting Time (WT) |
|---|---|---|---|
| P1 | 8 | 8 | 0 |
| P2 | 15 | 14 | 10 |
| P3 | 29 | 27 | 18 |
| P4 | 20 | 17 | 12 |
| P5 | 11 | 7 | 4 |
Formula for average TAT and WT:
- Average Turn Around Time (Average TAT) = Σ(TAT) / Number of Processes
- Average Waiting Time (Average WT) = Σ(WT) / Number of Processes
Average Turn Around Time (TAT) = (8+14+27+17+7)/5=14.6 units
Average Waiting Time (WT) = (0+10+18+12+4)/5 = 8.8 units
Question 3: Using Non-Preemptive Shortest Job First (SJF) scheduling, schedule the following processes based on their Arrival and Burst Times. Then find the average Turn Around Time, Completion Time, and Waiting Time, and draw the Gantt chart.
| Process | Arrival Time | Burst Time |
|---|---|---|
| P1 | 0 | 10 |
| P2 | 1 | 1 |
| P3 | 2 | 2 |
| P4 | 3 | 1 |
| P5 | 4 | 5 |
Solution :
Formulas:
- Turn Around Time (TAT) = Completion Time (CT) - Arrival Time (AT)
- Waiting Time (WT) = Turn Around Time (TAT) - Burst Time (BT)
Gantt Chart
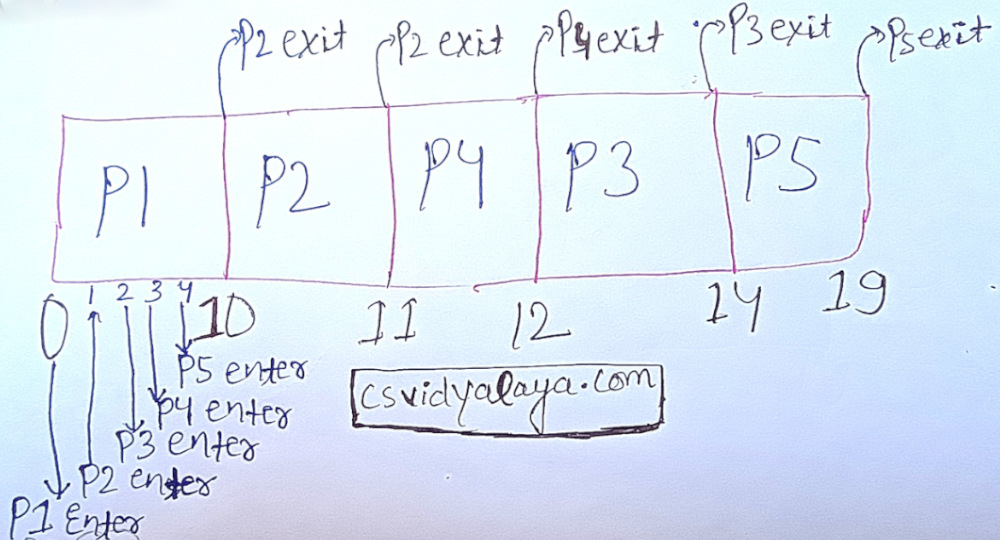
| Process | Completion Time | Turn Around Time (TAT) | Waiting Time (WT) |
|---|---|---|---|
| P1 | 10 | 10 | 0 |
| P2 | 11 | 10 | 9 |
| P3 | 14 | 12 | 10 |
| P4 | 12 | 9 | 8 |
| P5 | 19 | 15 | 10 |
Formula for average TAT and WT:
- Average Turn Around Time (Average TAT) = Σ(TAT) / Number of Processes
- Average Waiting Time (Average WT) = Σ(WT) / Number of Processes
Average Turn Around Time (TAT) = (10+10+12+9+15)/5 = 11.2 units
Average Waiting Time (WT) = (0+9+10+8+10)/5 = 7.4 units
Question 4: Consider a set of processes with their Arrival and Burst Times. Use the Non-Preemptive SJF scheduling algorithm to generate a Gantt chart and determine the average Turnaround, Completion, and Waiting Times.
| Process | Arrival Time | Burst Time |
|---|---|---|
| P1 | 0 | 7 |
| P2 | 2 | 4 |
| P3 | 4 | 1 |
| P4 | 5 | 4 |
| P5 | 6 | 3 |
Solution :
Formulas:
- Turnaround Time (TAT) = Completion Time - Arrival Time
- Waiting Time (WT) = Turnaround Time - Burst Time
Gantt Chart
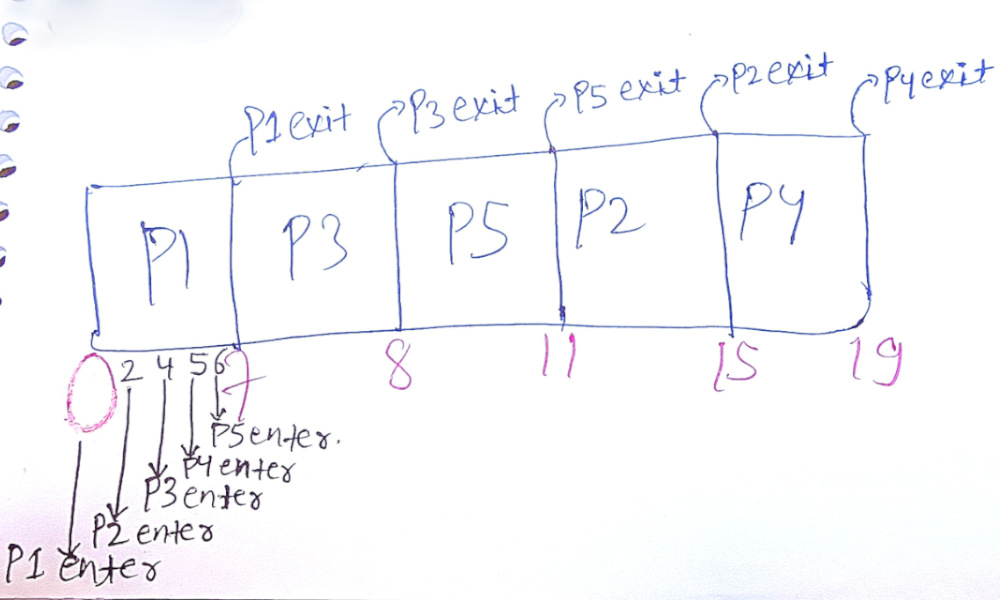
| Process | Completion Time | Turnaround Time (TAT) | Waiting Time (WT) |
|---|---|---|---|
| P1 | 7 | 7 - 0 = 7 | 7 - 7 = 0 |
| P2 | 15 | 15 - 2 = 13 | 13 - 4 = 9 |
| P3 | 8 | 8 - 4 = 4 | 4 - 1 = 3 |
| P4 | 19 | 19 - 5 = 14 | 14 - 4 = 10 |
| P5 | 11 | 11 - 6 = 5 | 5 - 3 = 2 |
Formulas for Average TAT and WT
- Average Turnaround Time = Sum of Turnaround Times / Number of Processes
- Average Waiting Time = Sum of Waiting Times / Number of Processes
Average TAT and WT
Average TAT = (7 + 13 + 4 + 14 + 5) / 5 = 43 / 5 = 8.6 units
Average WT = (0 + 9 + 3 + 10 + 2) / 5 = 24 / 5 = 4.8 units
Question 5: Schedule the given processes using the Non-Preemptive Shortest Job First algorithm. Use the Arrival and Burst Times from the table to draw the Gantt chart and calculate average Completion, Turnaround, and Waiting Times.
| Process | Arrival Time | Burst Time |
|---|---|---|
| P1 | 0 | 8 |
| P2 | 1 | 4 |
| P3 | 2 | 9 |
| P4 | 3 | 5 |
| P5 | 4 | 2 |
Solution :
Formulas:
- Turnaround Time (TAT) = Completion Time - Arrival Time
- Waiting Time (WT) = Turnaround Time - Burst Time
Gantt Chart
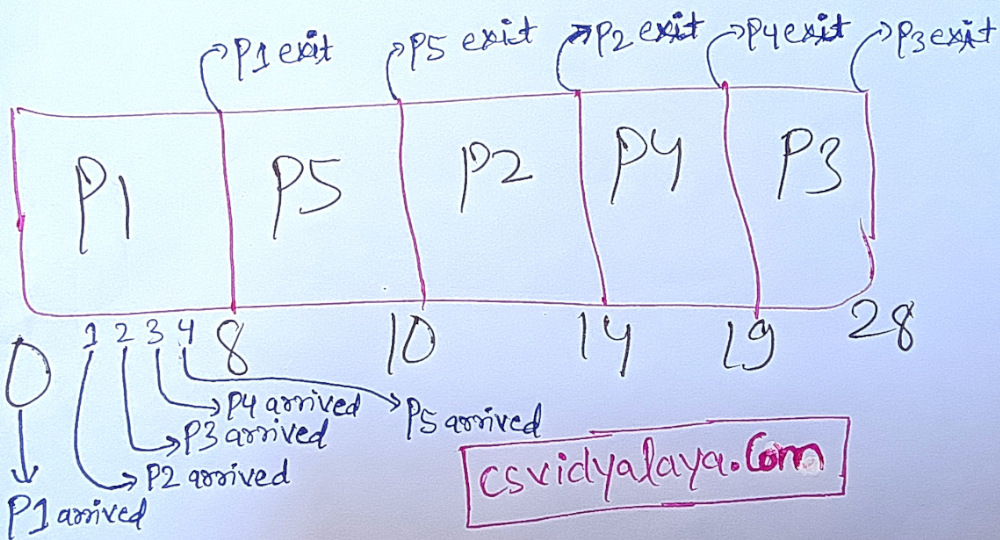
| Process | Completion Time | Turnaround Time (TAT) | Waiting Time (WT) |
|---|---|---|---|
| P1 | 8 | 8 - 0 = 8 | 8 - 8 = 0 |
| P2 | 14 | 14 - 1 = 13 | 13 - 4 = 9 |
| P3 | 28 | 28 - 2 = 26 | 26 - 9 = 17 |
| P4 | 19 | 19 - 3 = 16 | 16 - 5 = 11 |
| P5 | 10 | 10 - 4 = 6 | 6 - 2 = 4 |
Formulas for Average TAT and WT
- Average Turnaround Time = Sum of Turnaround Times / Number of Processes
- Average Waiting Time = Sum of Waiting Times / Number of Processes
Average TAT and WT
Average TAT = (8 + 13 + 26 + 16 + 6) / 5 = 69 / 5 = 13.8 units
Average WT = (0 + 9 + 17 + 11 + 4) / 5 = 41 / 5 = 8.2 units
Question 6:For the processes listed with specific Arrival and Burst Times, use Non-Preemptive SJF scheduling to determine their execution order. Create a Gantt chart and compute the average Turnaround Time, Completion Time, and Waiting Time
| Process | Arrival Time | Burst Time |
|---|---|---|
| P1 | 1 | 6 |
| P2 | 2 | 3 |
| P3 | 3 | 4 |
| P4 | 4 | 2 |
| P5 | 5 | 5 |
| P6 | 6 | 3 |
Solution :
Formulas:
- Turnaround Time (TAT) = Completion Time - Arrival Time
- Waiting Time (WT) = Turnaround Time - Burst Time
Gantt Chart
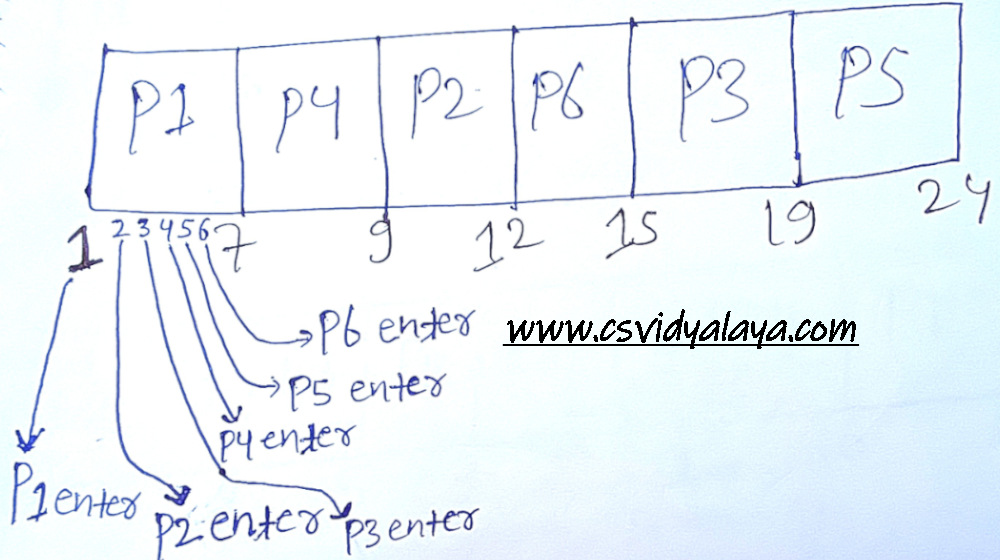
| Process | Completion Time | Turnaround Time (TAT) | Waiting Time (WT) |
|---|---|---|---|
| P1 | 7 | 7 - 1 = 6 | 6 - 6 = 0 |
| P2 | 12 | 12 - 2 = 10 | 10 - 3 = 7 |
| P3 | 19 | 19 - 3 = 16 | 16 - 4 = 12 |
| P4 | 9 | 9 - 4 = 5 | 5 - 2 = 3 |
| P5 | 24 | 24 - 5 = 19 | 19 - 5 = 14 |
| P6 | 15 | 15 - 6 = 9 | 9 - 3 = 6 |
Formulas for Average TAT and WT
- Average Turnaround Time = Sum of Turnaround Times / Number of Processes
- Average Waiting Time = Sum of Waiting Times / Number of Processes
Average TAT and WT
Average TAT = (6 + 10 + 16 + 5 + 19 + 9) / 6 = 65 / 6 = 10.83 units
Average WT = (0 + 7 + 12 + 3 + 14 + 6) / 6 = 42 / 6 = 7 units
Question 7: Using the data in the table (Arrival and Burst Times), apply the Non-Preemptive Shortest Job First scheduling technique to compute the average Waiting Time, Turnaround Time, and Completion Time. Also, represent the process flow using a Gantt chart.
| Process | Arrival Time | Burst Time |
|---|---|---|
| P1 | 0 | 8 |
| P2 | 1 | 4 |
| P3 | 2 | 9 |
| P4 | 3 | 5 |
| P5 | 4 | 2 |
Solution :
Formulas:
- Turn Around Time (TAT) = Completion Time (CT) - Arrival Time (AT)
- Waiting Time (WT) = Turn Around Time (TAT) - Burst Time (BT)
Gantt Chart
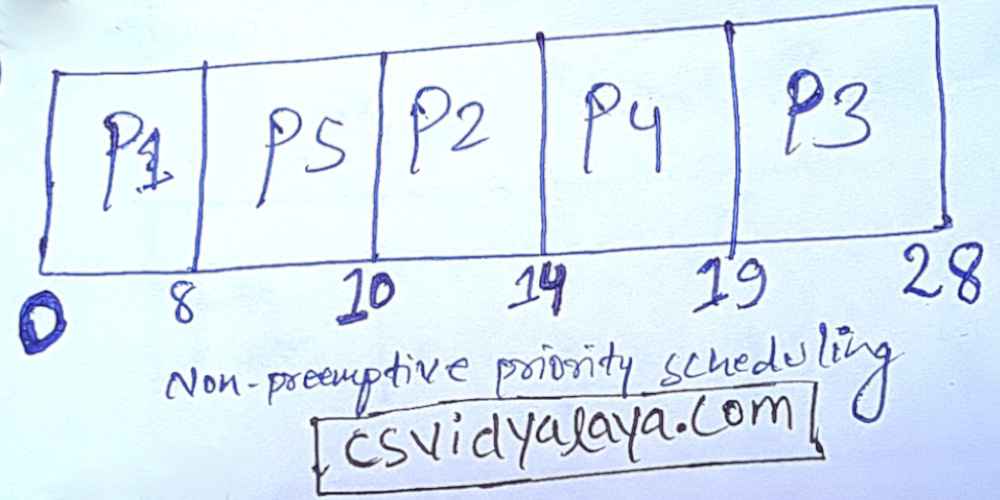
| Process | Completion Time | Turn Around Time (TAT) | Waiting Time (WT) |
|---|---|---|---|
| P1 | 8 | 8 - 0 = 8 | 8 - 8 = 0 |
| P5 | 10 | 10 - 4 = 6 | 6 - 2 = 4 |
| P2 | 14 | 14 - 1 = 13 | 13 - 4 = 9 |
| P4 | 19 | 19 - 3 = 16 | 16 - 5 = 11 |
| P3 | 28 | 28 - 2 = 26 | 26 - 9 = 17 |
Formula for average TAT and WT:
- Average Turn Around Time (Average TAT) = Σ(TAT) / Number of Processes
- Average Waiting Time (Average WT) = Σ(WT) / Number of Processes
Average TAT = (8 + 6 + 13 + 16 + 26) / 5 = 13.8
Average WT = (0 + 4 + 9 + 11 + 17) / 5 = 8.2
Question 8: Given process details with Arrival and Burst Times, apply the Non-Preemptive SJF scheduling algorithm. Calculate the average Completion, Turnaround, and Waiting Times and also draw the corresponding Gantt chart.
| Process | Arrival Time | Burst Time |
|---|---|---|
| P1 | 0 | 5 |
| P2 | 1 | 3 |
| P3 | 2 | 8 |
| P4 | 3 | 6 |
| P5 | 4 | 2 |
Solution :
Formulas:
- Turn Around Time (TAT) = Completion Time (CT) - Arrival Time (AT)
- Waiting Time (WT) = Turn Around Time (TAT) - Burst Time (BT)
Gantt Chart
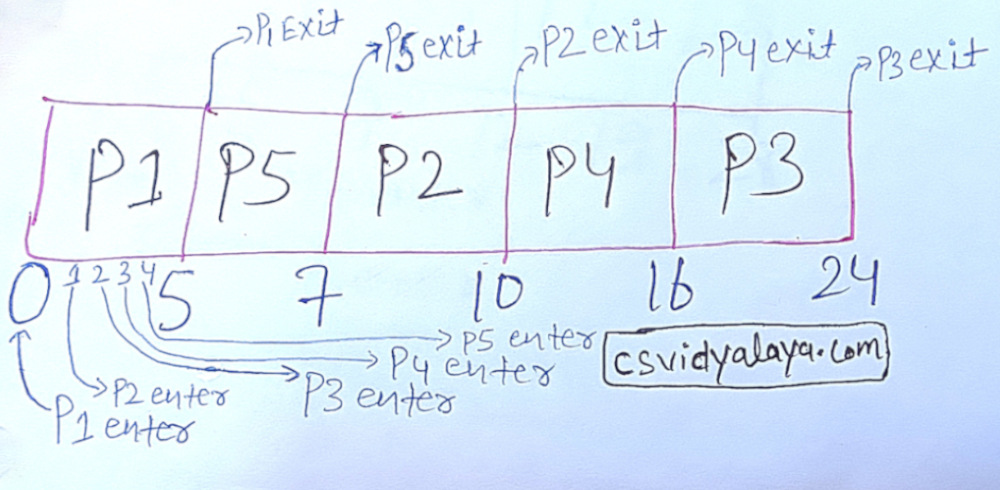
| Process | Completion Time | Turn Around Time (TAT) | Waiting Time (WT) |
|---|---|---|---|
| P1 | 5 | 5 - 0 = 5 | 5 - 5 = 0 |
| P5 | 7 | 7 - 4 = 3 | 3 - 2 = 1 |
| P2 | 10 | 10 - 1 = 9 | 9 - 3 = 6 |
| P4 | 16 | 16 - 3 = 13 | 13 - 6 = 7 |
| P3 | 24 | 24 - 2 = 22 | 22 - 8 = 14 |
Formula for average TAT and WT:
- Average Turn Around Time (Average TAT) = Σ(TAT) / Number of Processes
- Average Waiting Time (Average WT) = Σ(WT) / Number of Processes
Average TAT = (5 + 3 + 9 + 13 + 22) / 5 = 10.4
Average WT = (0 + 1 + 6 + 7 + 14) / 5 = 5.6
Question 9: Use the Non-Preemptive Shortest Job First (SJF) approach to schedule processes based on the table of Arrival and Burst Times. Draw the Gantt chart and calculate the average Completion Time, Turnaround Time, and Waiting Time.
| Process | Arrival Time | Burst Time |
|---|---|---|
| P1 | 0 | 3 |
| P2 | 1 | 6 |
| P3 | 3 | 8 |
| P4 | 5 | 5 |
| P5 | 6 | 4 |
| P6 | 7 | 2 |
Solution :
Formulas:
- Turn Around Time (TAT) = Completion Time (CT) - Arrival Time (AT)
- Waiting Time (WT) = Turn Around Time (TAT) - Burst Time (BT)
Gantt Chart
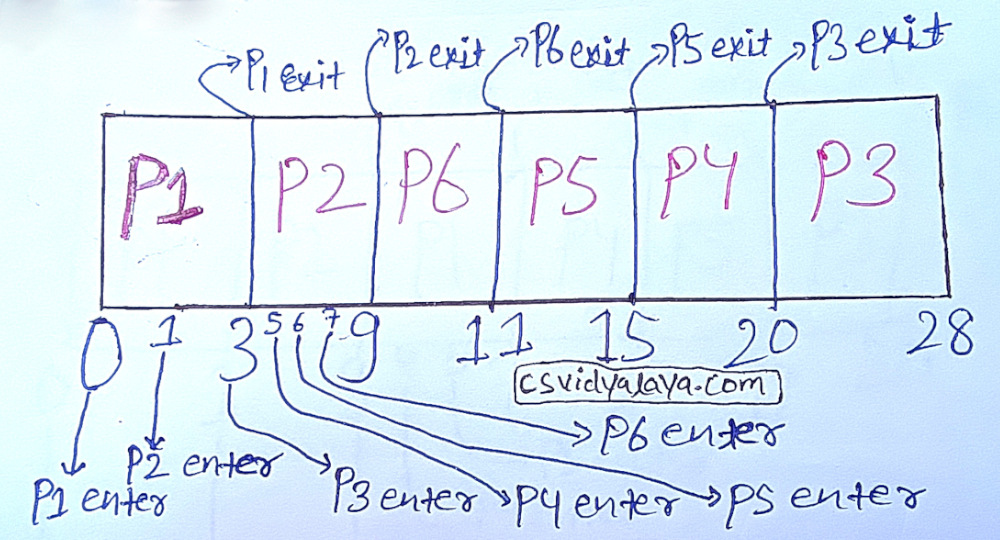
| Process | Completion Time | Turn Around Time (TAT) | Waiting Time (WT) |
|---|---|---|---|
| P1 | 3 | 3 - 0 = 3 | 3 - 3 = 0 |
| P2 | 9 | 9 - 1 = 8 | 8 - 6 = 2 |
| P3 | 28 | 28 - 3 = 25 | 25 - 8 = 17 |
| P4 | 20 | 20 - 5 = 15 | 15 - 5 = 10 |
| P5 | 15 | 15 - 6 = 9 | 9 - 4 = 5 |
| P6 | 11 | 11 - 7 = 4 | 4 - 2 = 2 |
Formula for average TAT and WT:
- Average Turn Around Time (Average TAT) = Σ(TAT) / Number of Processes
- Average Waiting Time (Average WT) = Σ(WT) / Number of Processes
Average TAT = (3 + 8 + 25 + 15 + 9 + 4) / 6 = 10.6
Average WT = (0 + 2 + 17 + 10 + 5 + 2) / 6 = 6
Question 10: From the given process table containing Arrival and Burst Times, apply Non-Preemptive Shortest Job First scheduling. Draw the Gantt chart and compute the average values for Waiting Time, Completion Time, and Turnaround Time.
| Process | Arrival Time | Burst Time |
|---|---|---|
| P1 | 0 | 2 |
| P2 | 1 | 3 |
| P3 | 2 | 4 |
| P4 | 3 | 6 |
| P5 | 4 | 1 |
| P6 | 5 | 5 |
Solution :
Formulas:
- Turn Around Time (TAT) = Completion Time (CT) - Arrival Time (AT)
- Waiting Time (WT) = Turn Around Time (TAT) - Burst Time (BT)
Gantt Chart
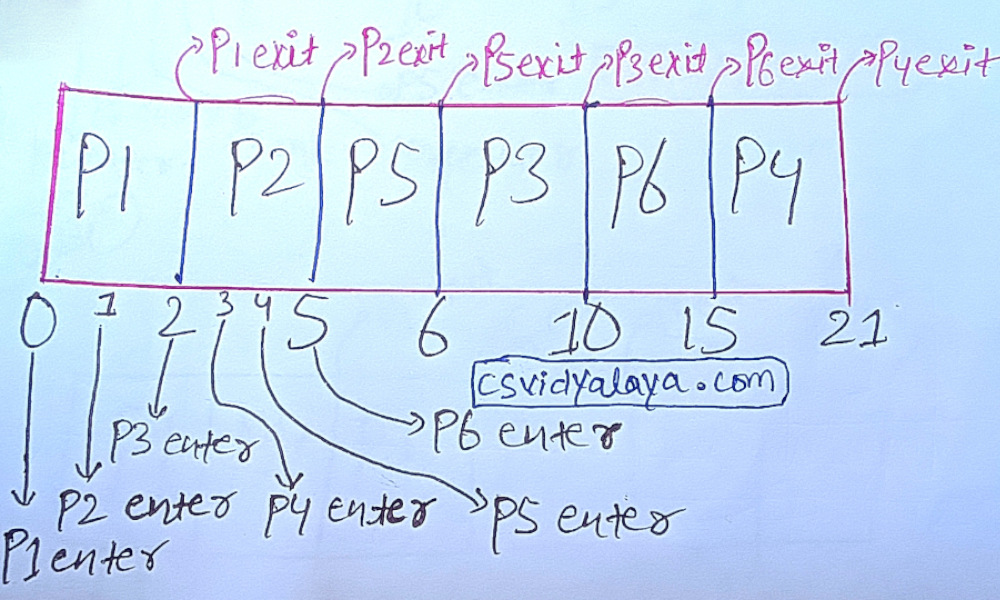
| Process | Completion Time | Turn Around Time (TAT) | Waiting Time (WT) |
|---|---|---|---|
| P1 | 2 | 2 - 0 = 2 | 2 - 2 = 0 |
| P2 | 5 | 5 - 1 = 4 | 4 - 3 = 1 |
| P3 | 10 | 10 - 2 = 8 | 8 - 4 = 4 |
| P4 | 21 | 21 - 3 = 18 | 18 - 6 = 12 |
| P5 | 6 | 6 - 4 = 2 | 2 - 1 = 1 |
| P6 | 15 | 15 - 5 = 10 | 10 - 5 = 5 |
Formula for average TAT and WT:
- Average Turn Around Time (Average TAT) = Σ(TAT) / Number of Processes
- Average Waiting Time (Average WT) = Σ(WT) / Number of Processes
Average TAT = (2+4+8+18+2+10) / 6 = 7.33
Average WT = (0 + 1 + 4 +12 + 1+5) / 6 = 3.83
Question 11: Using the Non-Preemptive Shortest Job First (SJF) scheduling algorithm, determine the execution sequence of the given processes based on their Arrival and Burst Times. Illustrate the process flow with a Gantt chart and calculate the average Completion Time, Turnaround Time, and Waiting Time.
| Process | Arrival Time | Burst Time |
|---|---|---|
| P1 | 0 | 8 |
| P2 | 1 | 3 |
| P3 | 2 | 7 |
| P4 | 3 | 4 |
| P5 | 4 | 2 |
Solution :
Formulas:
- Turn Around Time (TAT) = Completion Time (CT) - Arrival Time (AT)
- Waiting Time (WT) = Turn Around Time (TAT) - Burst Time (BT)
Gantt Chart
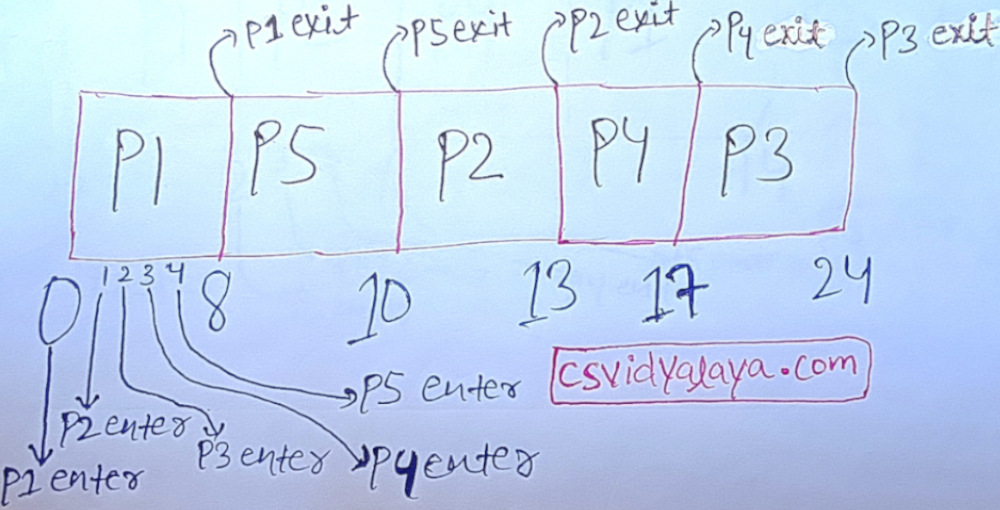
| Process | Completion Time | Turn Around Time (TAT) | Waiting Time (WT) |
|---|---|---|---|
| P1 | 8 | 8 - 0 = 8 | 8 - 8 = 0 |
| P2 | 13 | 13 - 1 = 12 | 12 - 3 = 9 |
| P3 | 24 | 24 - 2 = 22 | 22 - 7 = 15 |
| P4 | 17 | 17 - 3 = 14 | 14 - 4 = 10 |
| P5 | 10 | 10 - 4 = 6 | 6 - 2 = 4 |
Formula for average TAT and WT:
- Average Turn Around Time (Average TAT) = Σ(TAT) / Number of Processes
- Average Waiting Time (Average WT) = Σ(WT) / Number of Processes
Average TAT = (8 + 6 + 12 + 14 + 22) / 5 = 12.4
Average WT = (0 + 4 + 9 + 10 + 15) / 5 = 7.6
