Here are 31 questions on PS(Priority Scheduling) process scheduling algorithms (premptive And non-premptive). Each question is presented in a table format, followed by the solution with Gantt charts, average turnaround time (TAT), and average waiting time (WT).
Question 1: Using Preemptive Priority Scheduling, calculate the average Turnaround Time, Completion Time, and Waiting Time for the processes listed in the table. Also, draw the Gantt chart based on the given Arrival Time, Burst Time, and Priority.
| Process | Arrival Time | Burst Time | Priority |
|---|---|---|---|
| P1 | 0 | 5 | 3 |
| P2 | 1 | 3 | 1 |
| P3 | 2 | 4 | 4 |
| P4 | 3 | 2 | 2 |
| P5 | 4 | 6 | 5 |
Solution :
lower number represents higher priority (here i take 1 as a highest priority)
Formula:
- Turnaround Time = Completion Time - Arrival Time
- Waiting Time = Turnaround Time - Burst Time
- Average Turnaround Time = Sum of Turnaround Times / Number of Processes
- Average Waiting Time = Sum of Waiting Times / Number of Processes
Gantt Chart
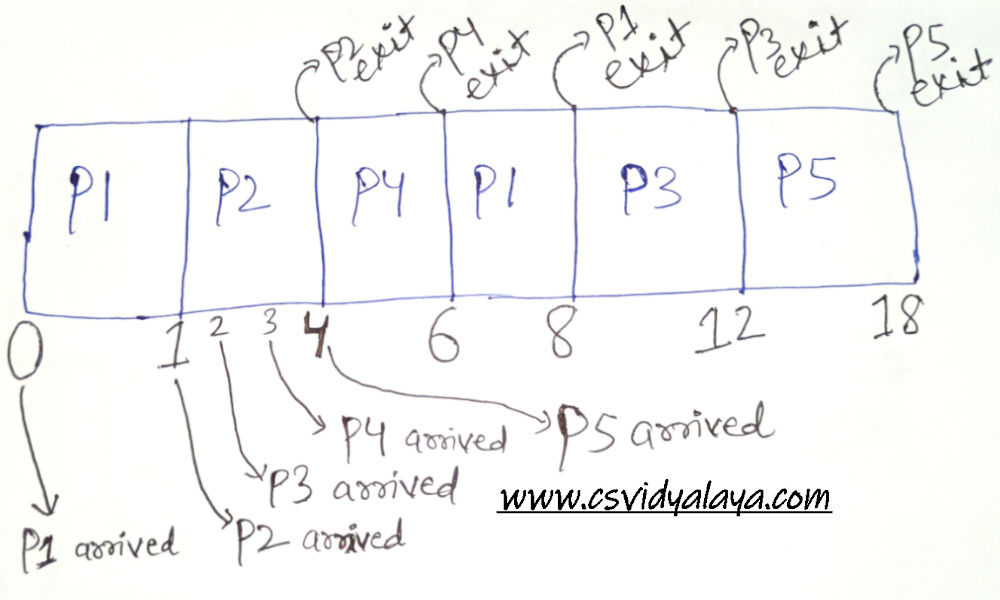
| P1 (0-1) | P2 (1-4) | P4 (4-6) | P1 (6-8) | P3 (8-12) | P5 (12-18) |
| Process | Completion Time | Turnaround Time (TAT) | Waiting Time (WT) |
|---|---|---|---|
| P1 | 8 | 8 - 0 = 8 | 8 - 5 = 3 |
| P2 | 4 | 4 - 1 = 3 | 3 - 3 = 0 |
| P3 | 12 | 12 - 2 = 10 | 10 - 4 = 6 |
| P4 | 6 | 6 - 3 = 3 | 3 - 2 = 1 |
| P5 | 18 | 18 - 4 = 14 | 14 - 6 = 8 |
Average Turnaround Time:
(8 + 3 + 10 + 3 + 14) / 5 = 7.6 units
Average Waiting Time:
(3 + 0 + 6 + 1 + 8) / 5 = 3.6 units
Gantt Chart
| P1 (0-1) | P2 (1-4) | P4 (4-6) | P1 (6-8) | P3 (8-12) | P5 (12-18) |
Question 2 : Given a set of processes with respective Arrival Times, Burst Times, and Priorities, apply Preemptive Priority Scheduling to compute the Gantt chart and find the average Waiting Time, Completion Time, and Turnaround Time.
| Process | Arrival Time | Burst Time | Priority |
|---|---|---|---|
| P1 | 0 | 6 | 1 |
| P2 | 2 | 2 | 3 |
| P3 | 4 | 8 | 2 |
| P4 | 6 | 4 | 4 |
Solution :
lower number represents higher priority (here i take 1 as a highest priority)
Formula:
- Turnaround Time = Completion Time - Arrival Time
- Waiting Time = Turnaround Time - Burst Time
- Average Turnaround Time = Sum of Turnaround Times / Number of Processes
- Average Waiting Time = Sum of Waiting Times / Number of Processes
Gantt Chart
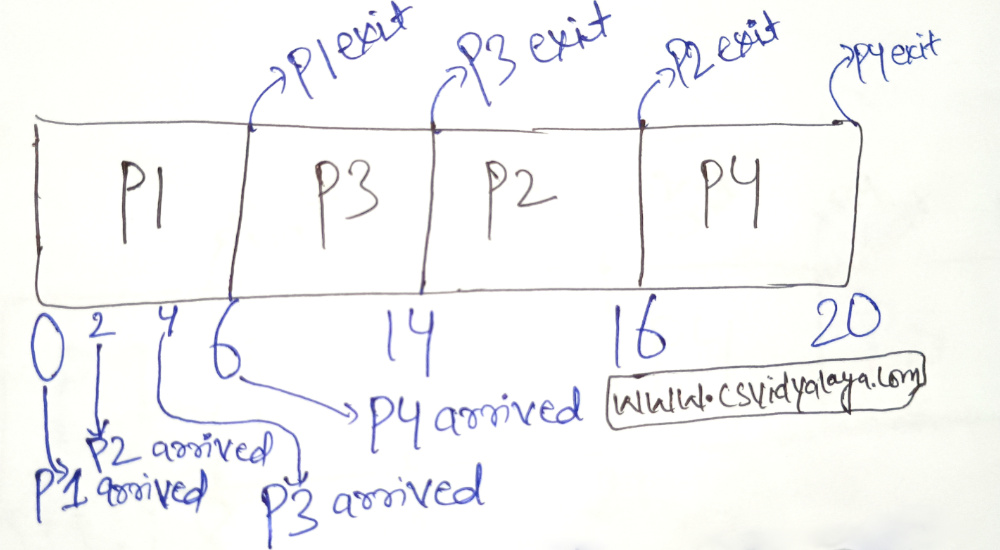
| Process | Completion Time | Turnaround Time | Waiting Time |
|---|---|---|---|
| P1 | 6 | 6 | 0 |
| P2 | 16 | 14 | 12 |
| P3 | 14 | 10 | 2 |
| P4 | 20 | 14 | 10 |
Average Turnaround Time: (6+14+10+14)/4 = 11
Average Waiting Time: (0+12+2+10)/4 = 6
Question 3 : Draw the Gantt chart and calculate the average Turnaround Time, Completion Time, and Waiting Time using the Preemptive Priority Scheduling technique for the processes listed with their Arrival Time, Burst Time, and Priority.
| Process | Arrival Time | Burst Time | Priority |
|---|---|---|---|
| P1 | 0 | 7 | 2 |
| P2 | 1 | 4 | 1 |
| P3 | 2 | 6 | 3 |
| P4 | 3 | 3 | 4 |
Solution :
lower number represents higher priority (here i take 1 as a highest priority)
Formula:
- Turnaround Time = Completion Time - Arrival Time
- Waiting Time = Turnaround Time - Burst Time
- Average Turnaround Time = Sum of Turnaround Times / Number of Processes
- Average Waiting Time = Sum of Waiting Times / Number of Processes
Gantt Chart
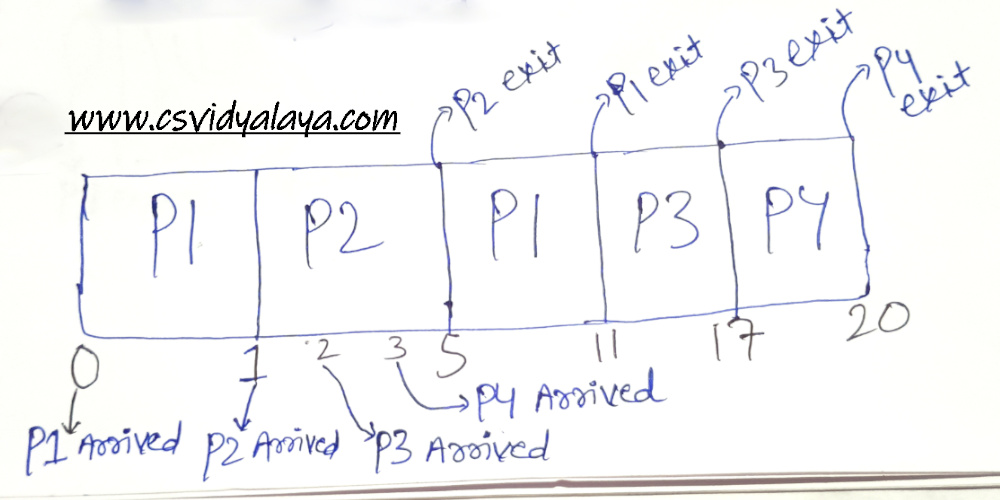
| Process | Completion Time | Turnaround Time | Waiting Time |
|---|---|---|---|
| P1 | 11 | 11 | 4 |
| P2 | 5 | 4 | 0 |
| P3 | 17 | 15 | 9 |
| P4 | 20 | 17 | 14 |
Average Turnaround Time: (11+4+15+17)/4 = 11.75
Average Waiting Time: (4+0+9+14)/4 = 6.75
Question 4 : Consider the processes provided with their Arrival, Burst, and Priority values. Using Preemptive Priority Scheduling, determine the scheduling order and calculate the average Completion, Turnaround, and Waiting Times. Also, illustrate the Gantt chart.
| Process | Arrival Time | Burst Time | Priority |
|---|---|---|---|
| P1 | 0 | 7 | 1 |
| P2 | 2 | 4 | 2 |
| P3 | 4 | 1 | 3 |
| P4 | 5 | 3 | 1 |
| P5 | 6 | 2 | 4 |
Solution :
lower number represents higher priority (here i take 1 as a highest priority)
Formula:
- Turnaround Time = Completion Time - Arrival Time
- Waiting Time = Turnaround Time - Burst Time
- Average Turnaround Time = Sum of Turnaround Times / Number of Processes
- Average Waiting Time = Sum of Waiting Times / Number of Processes
Gantt Chart
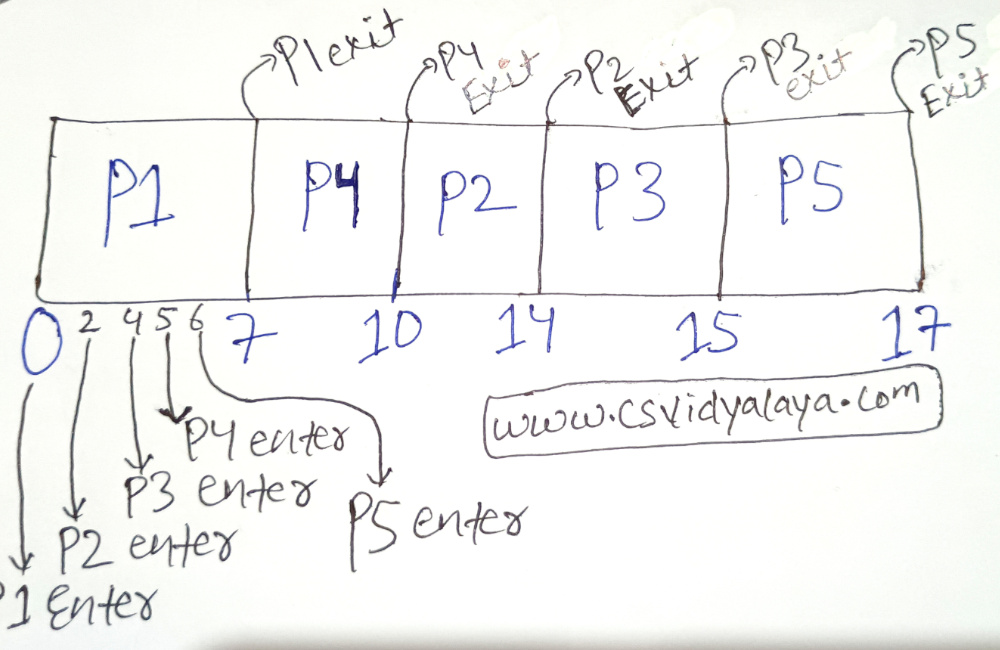
| Process | Completion Time | Turnaround Time (TAT) | Waiting Time (WT) |
|---|---|---|---|
| P1 | 7 | 7 - 0 = 7 | 7 - 7 = 0 |
| P2 | 14 | 14 - 2 = 12 | 12 - 4 = 8 |
| P3 | 15 | 15 - 4 = 11 | 11 - 1 = 10 |
| P4 | 10 | 10 - 5 = 5 | 5 - 3 = 2 |
| P5 | 17 | 17 - 6 = 11 | 11 - 2 = 09 |
Average Turnaround Time:
(7+12+11+5+11) / 5 = 9.2 units
Average Waiting Time:
(0+8+10+2+9) / 5 = 5.8 units
Question 5: Using the Preemptive Priority Scheduling algorithm, construct the Gantt chart and compute average Completion Time, Turn Around Time, and Waiting Time for a set of processes with given Arrival, Burst, and Priority data.
| Process | Arrival Time | Burst Time | Priority |
|---|---|---|---|
| P1 | 0 | 8 | 1 |
| P2 | 1 | 4 | 3 |
| P3 | 2 | 9 | 2 |
| P4 | 3 | 5 | 4 |
| P5 | 4 | 6 | 5 |
Solution :
lower number represents higher priority (here i take 1 as a highest priority)
Formula:
- Turnaround Time = Completion Time - Arrival Time
- Waiting Time = Turnaround Time - Burst Time
- Average Turnaround Time = Sum of Turnaround Times / Number of Processes
- Average Waiting Time = Sum of Waiting Times / Number of Processes
Gantt Chart
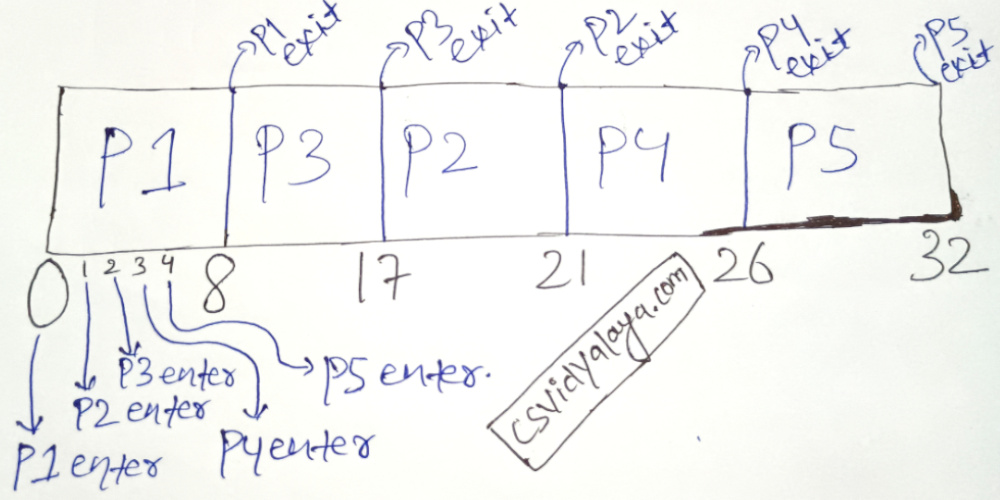
| Process | Completion Time | Turnaround Time (TAT) | Waiting Time (WT) |
|---|---|---|---|
| P1 | 8 | 8 - 0 = 8 | 8 - 8 = 0 |
| P2 | 21 | 21 - 1 = 20 | 20 - 4 = 16 |
| P3 | 17 | 17 - 2 = 15 | 15 - 9 = 6 |
| P4 | 26 | 26 - 3 = 23 | 23 - 5 = 18 |
| P5 | 32 | 32 - 4 = 28 | 28 - 6 = 22 |
Average Turnaround Time:
(20 + 8 + 15 + 23 + 28) / 5 = 18.8 units
Average Waiting Time:
(0 + 16 + 6 + 18 + 22) / 5 = 12.4 units
